
Search our website enhanced by Google.
The data below allows farmers to compare their technical and financial performance, year-on-year, with others with similar production systems, including internationally.
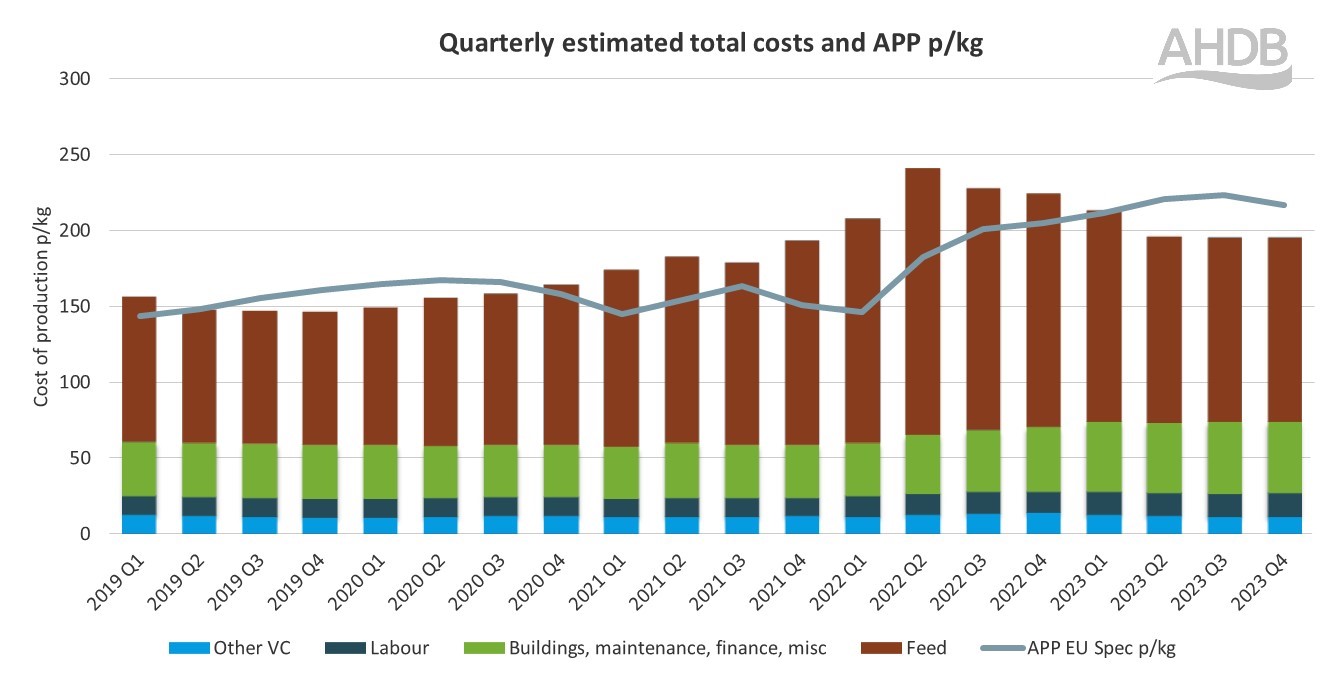
Our cost of pig production estimates in Figure 1 are updated quarterly.
Costs are broken down by feed, building, labour and other variables, and the price per kill (the APP EU spec line in the figure).
Figure 1. Estimated cost of pig production in Great Britain 2019–2023 (pence per kg)
The results are only indicative, due to:
To understand how these figures are derived see the cost of pig production estimation model explainer.
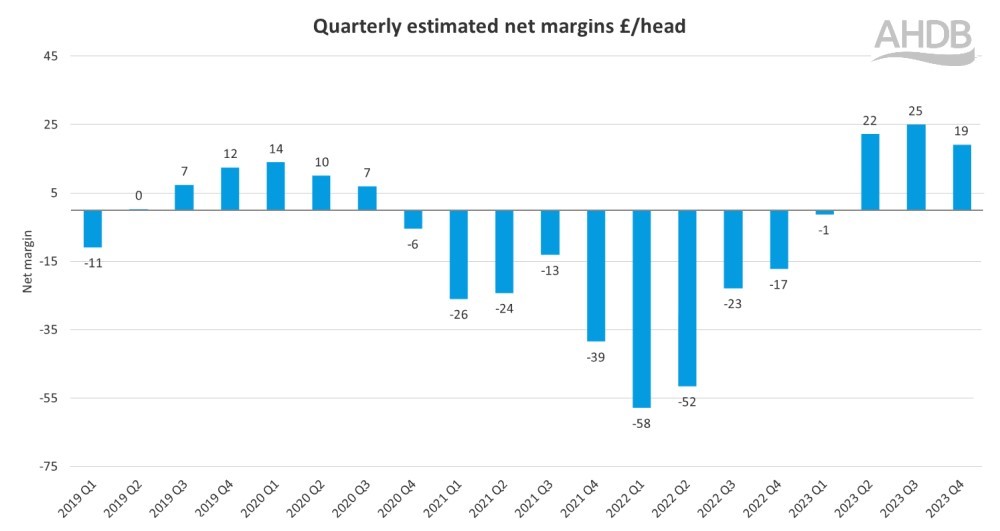
Our estimated net margins for pig production in Figure 2 are updated quarterly.
The net margin is based on the difference between:
Figure 2 shows these numbers for an average producer in GB using current known physical and financial assumptions.
Figure 2. Estimated net margin for pig production in Great Britain 2019–2023 (£ per head)
Download the data shown in Figure 2
KPIs help with decision making and improving performance. The tools below let you compare your business performance with other GB producers.
The five KPI tools each present a set of performance measures of GB pork producers. They show results from the top 10% and top 1/3 of producers, and average performance. You can add your own figures for each KPI and download a copy in Excel.
Indoor breeding herd Key Performance Indicators (KPIs)
Finishing (35–110 kg) herd Key Performance Indicators (KPIs)
Read more about how KPIs are used in the pork industry
International cost of production comparisons (InterPIG)
Download the 2020 report on alternative farrowing systems
Use our costs calculators to determine your pig production costs


