- Home
- Phoma leaf spot forecast
Phoma leaf spot forecast
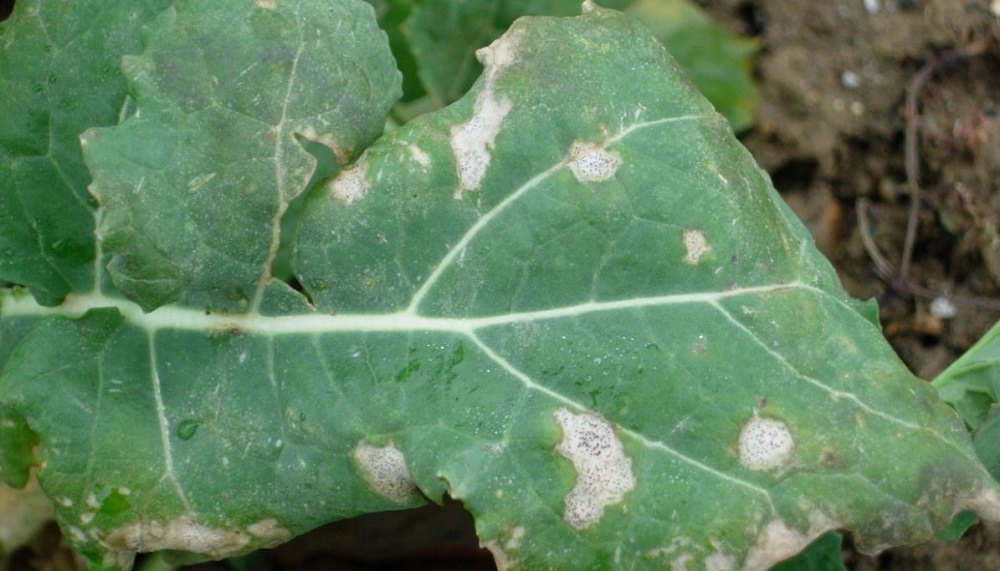
Use the phoma leaf spot forecast to guide crop monitoring and help time fungicide sprays in the autumn. Based on temperature and rainfall information, the model predicts treatment threshold starting-week dates at hundreds of locations.
About the forecast
Temperature and rainfall information* is used to simulate the development of Leptosphaeria maculans – a key pathogen responsible for phoma leaf spot and phoma stem canker.
The forecast page (<1 of 2>) predicts the date of the starting week when 10% of oilseed rape plants could potentially show symptoms of phoma leaf spot.
This level of infection relates to a treatment threshold for varieties with lower disease ratings for stem canker (7 and below).
The tool also shows how the current year compares to recent years – allowing ‘earliness’ or ‘lateness’ to be assessed.
The predicted infection status page (<2 of 2>) shows the proportion of the crop currently (today) forecast to have ‘no symptoms’, ‘infections taking place’ and ‘10% incidence'.
 AHDB
AHDB
Phoma leaf spot forecast (2023)
Very early phoma leaf spot forecast in oilseed rape (autumn 2023 news)
How dates are calculated
*The phoma leaf spot forecast is based on Equation 2.1 in Evans et al. (2007):
S = 196 + (216.5 – 0.24R – 4.55T)
S = Start date (Julian Day) of 10% phoma leaf spot incidence
196 = Julian Day for 15 July
216.5 = A constant value (originating from phoma modelling research)
‘T’ = Mean maximum daily temperature over the period 15 July to 26 September
‘R’ = Rainfall** (mm) over the period 15 July to 26 September
**A note on rainfall
AHDB-funded research (completed March 2021) found that the original model (developed in the early 2000s) – which used total rainfall information – predicted threshold breaches around two weeks earlier than seen in the field.
Since autumn 2021, the model only considers daily rainfall events up to 10 mm and total rainfall up to 200 mm, with additional rainfall having no influence. This change was made because dampness, rather than wetness, is more critical. As a result of the changes, the revised model tends to predict later start dates for threshold breaches. ‘Capped’ rainfall data has also been used retrospectively for the historic data in the above forecast, allowing forecast years to be compared.
Localised rain events are highly influential. Dates for 10% leaf spotting can vary tremendously (by a month or more), even at sites close to those monitored in the forecast. The forecast is likely to be most accurate in regions with no/limited variability in forecast dates. The forecast provides a general indication of the risk trends for the season and can only support field-level data and monitoring.
Notes on data sources
The phoma leaf spot forecast for each location uses rain-gauge data from the Environment Agency, Natural Resources Wales and Scottish Environment Protection Agency (to calculate the ‘R’ value) and mean maximum daily temperature data from the nearest Met Office weather station (to calculate the ‘T’ value). Locations associated with no/low oilseed rape areas are excluded from the analysis. Other locations were excluded when manual data quality control detected missing or unexpected data (e.g. rainfall values significantly out of line with neighbouring stations for several days).
How infection status is calculated
Timing of S (infection status)
- At least 8 days away (no symptoms)
- In the next 7 days (infections taking place)
- Today or in the past (10% incidence)

