
Search our website enhanced by Google.
Gross domestic product (GDP) is a measure of the size and health of an economy over time. The larger the GDP figure, the healthier the state of the economy. Figure 1 shows how the global economy has fared in recent years and forecast growth to 2024.
Figure 1. Global GDP growth, with predictions from 2022 onwards
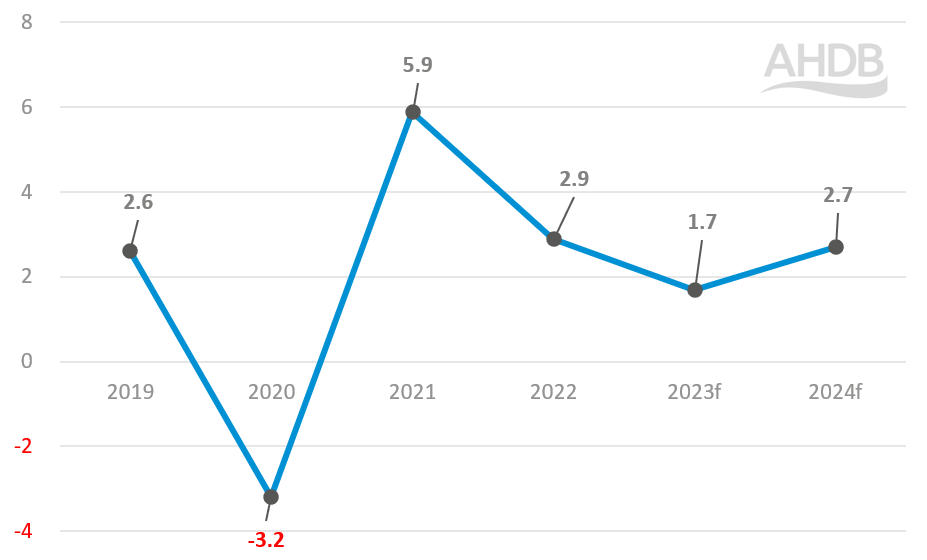
Source: World Bank
In 2021 COVID-19 caused the sharpest global recession since the Second World War. A brief rally followed, but the world economy is now suffering again. This time the cause is high inflation and slow growth (stagflation). Even if a global recession is averted, this period of stagflation could last for several years. The war in Ukraine, surging interest rates and inflation have combined to slow world economic growth, which is forecast to drop from 5.9% growth in 2021 to 2.9% in 2022.
The Ukraine conflict is leading to soaring prices and volatility in energy markets. Energy exporters have fared relatively well but this has been more than offset by net energy importers. The invasion of Ukraine has also led to a significant increase in agricultural commodity prices, which is exacerbating food insecurity and extreme poverty in many emerging markets and developing economies (EMDEs).
The adverse effects from this war will be most keenly felt in Europe and Central Asia, where output is forecast to contract sharply in 2023. Output growth is projected to slow in all regions except the Middle East and North Africa, where the benefits of high energy prices for energy exporters are expected to outweigh those prices’ negative impacts on other economies in the region.
Following the negative shock to global activity in 2022, no rebound is projected for 2023: global growth is forecast to fall to 1.7% that year. Many headwinds—in particular, high commodity prices and continued monetary tightening—are expected to persist. Moreover, the outlook is subject to various downside risks, including intensifying geopolitical tensions, growing stagflation, rising financial instability, continuing supply strains, and worsening food insecurity.
The global population reached eight billion in November 2022 – three times the size it was in 1950. The latest projections by the United Nations suggest that the world's population could grow to around 8.5 billion in 2030 and 9.7 billion in 2050. It is projected to reach a peak of around 10.4 billion people during the 2080s and to remain at that level until 2100.
Figure 2. Global population by region, 1985–2050
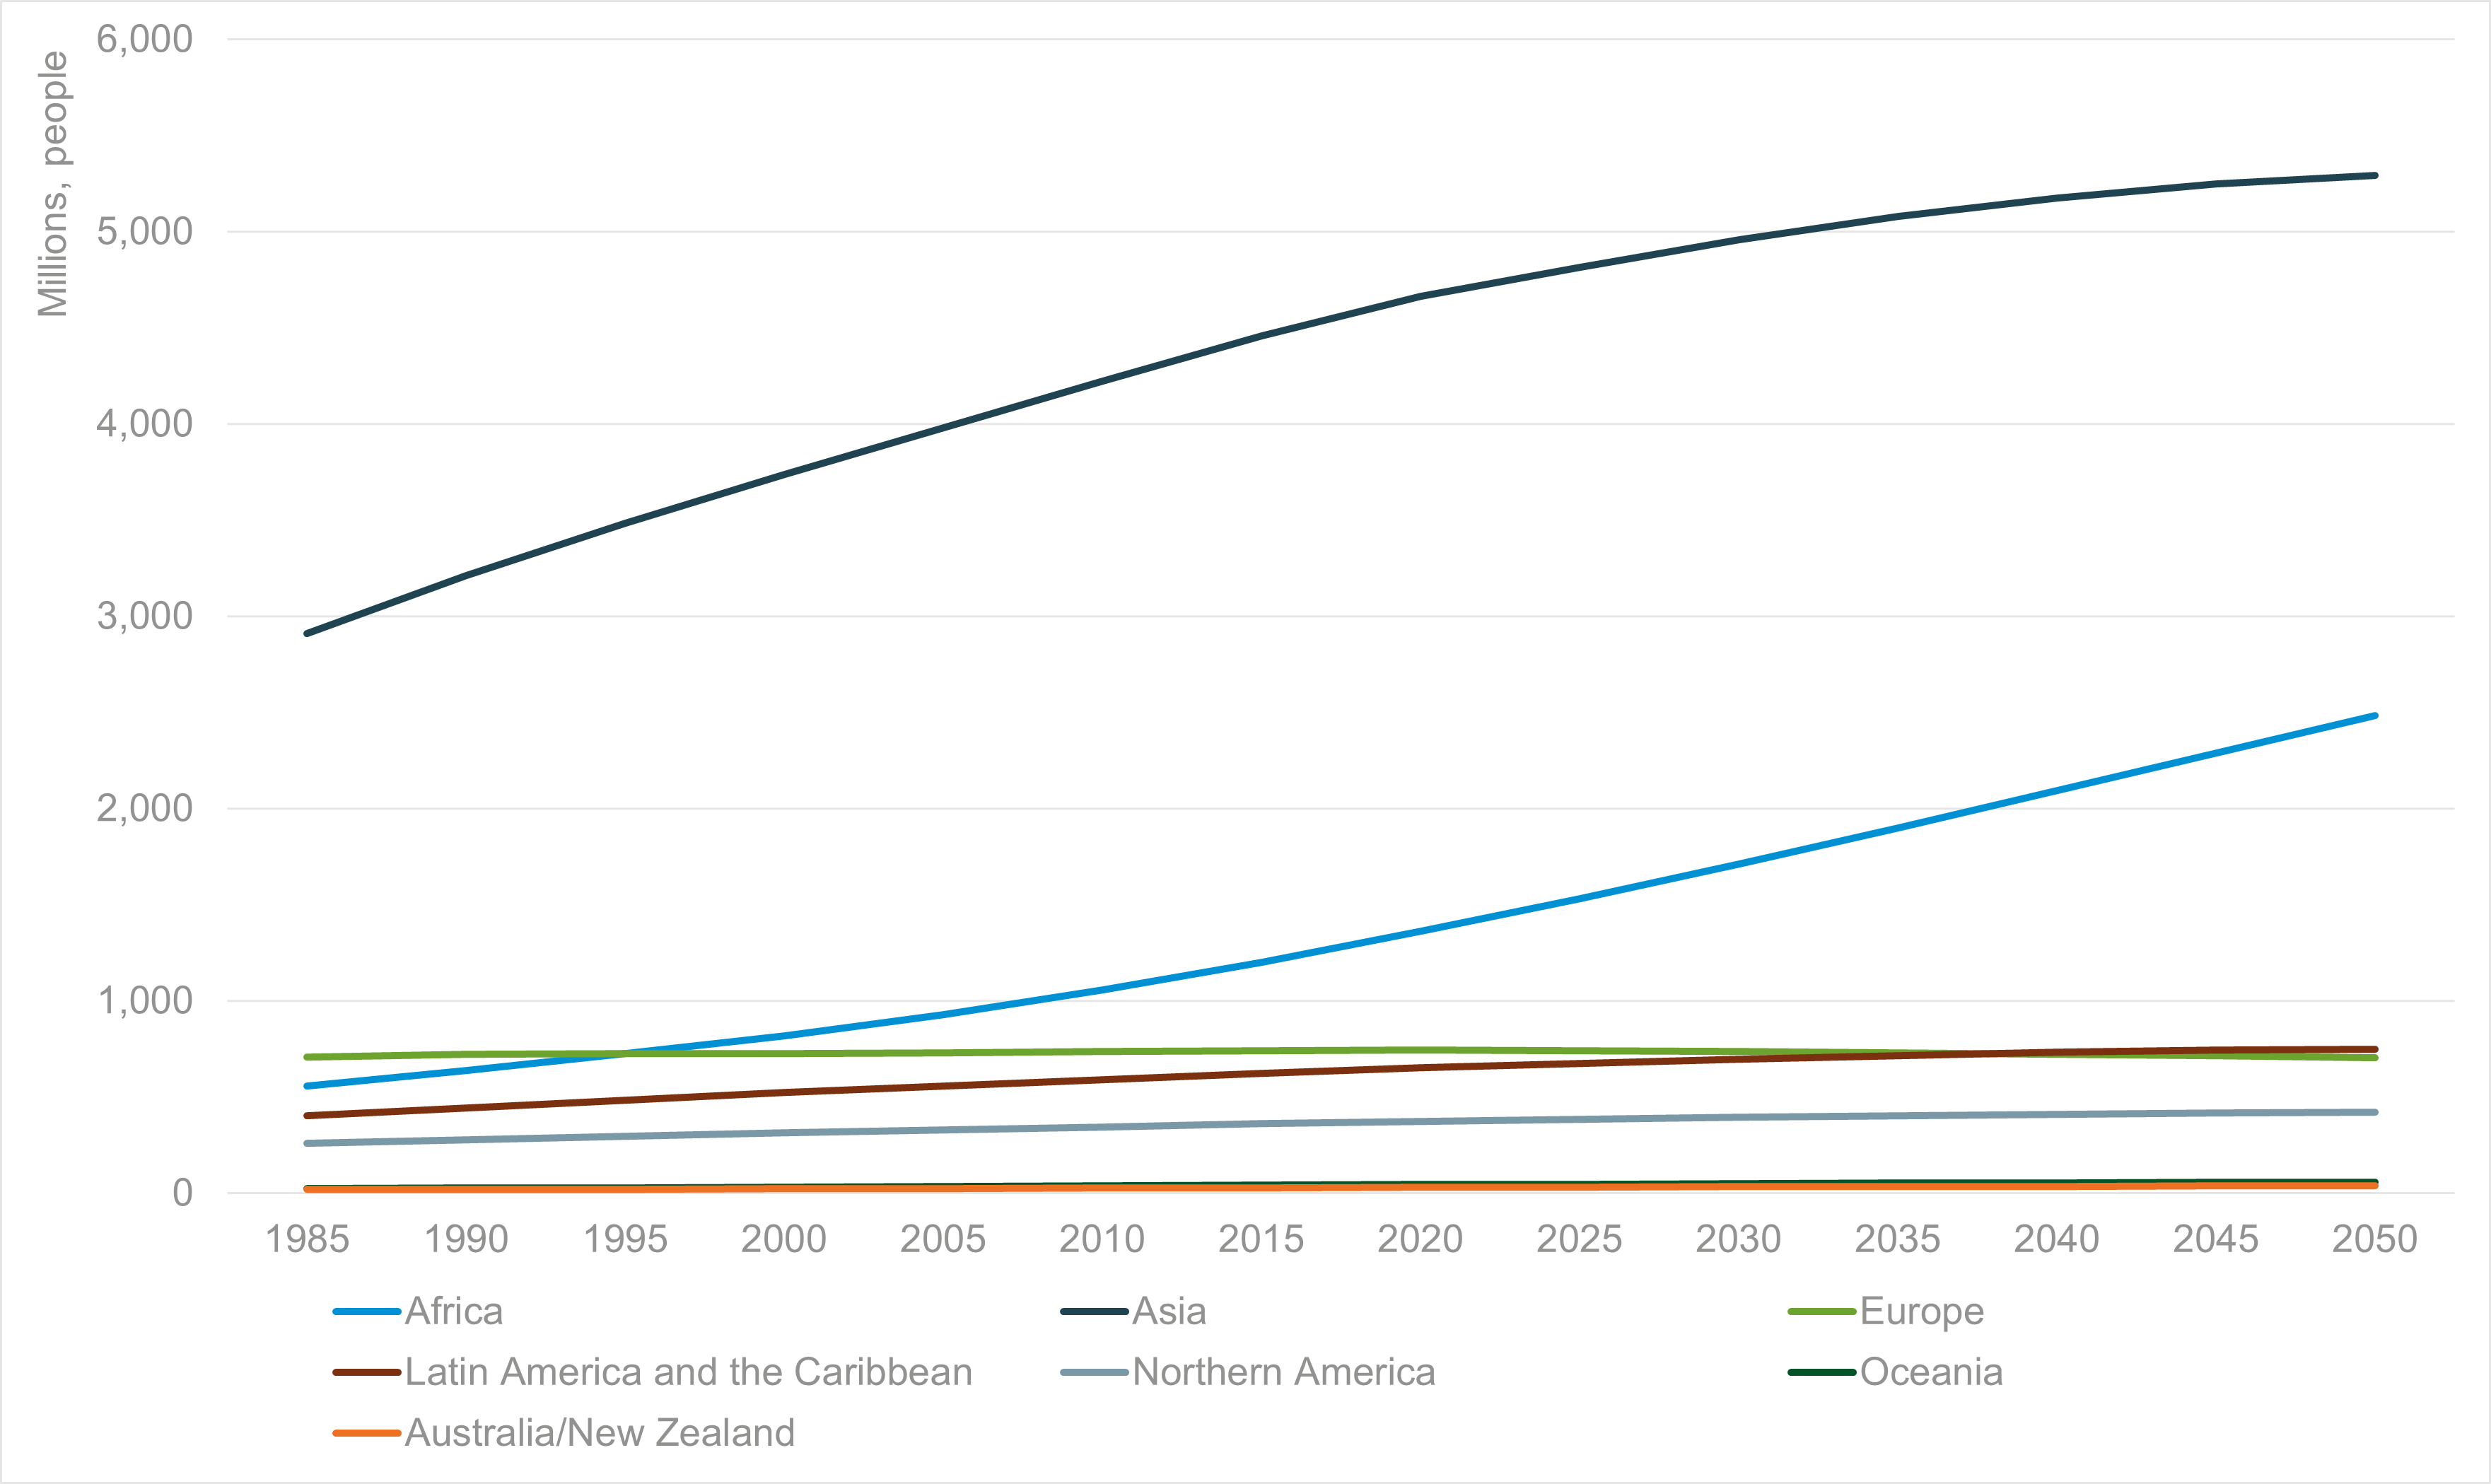
Source: United Nations 2022
The world population in 2021 was distributed as follows:
China (1.44 billion) and India (1.39 billion) remain the two most populous countries of the world, representing 19 and 18% of the world’s population, respectively. India is projected to overtake China as the world’s most populous country by 2027, while China’s population is projected to decrease by 31.4 million, or around 2.2%, between 2019 and 2050. (Source: World Population Prospects 2019)
Between now and 2050, more than half of global population growth is expected to occur in Africa, which already has the highest rate of population growth globally. The population of sub-Saharan Africa is projected to double by 2050.
In contrast, the populations of 55 countries or areas in the world, predominantly in Europe, are expected to decrease by 2050, of which 26 may see a reduction of at least 10%.
Increases in GDP and population growth in many countries and regions of the world have led to an increase in the so-called ‘middle income’ or ‘middle class’. These terms are used interchangeably to describe those above a certain income and consumption level per capita. Taking into account inflation, the income range for middle-class families can be expressed as $11 to $110 pppd in 2011 Purchasing Power Parity (PPP) terms. As Tables 1 and 2 show, the numbers of middle-income consumers, their % share of the global population and % share of spending power, particularly in Asia-Pacific, are set to increase dramatically.
Table 1. Number (millions) and share of the global middle class by region
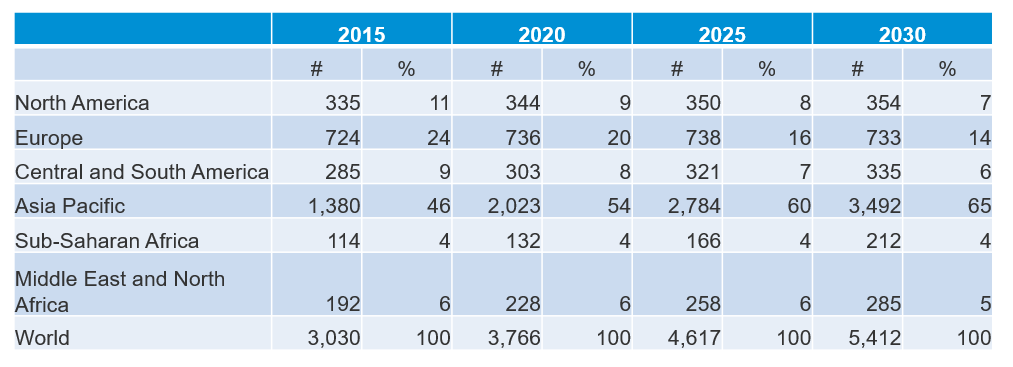
Source: Kharas 2017 – The unprecedented expansion of the global middle class
Table 2. Middle-class consumption (PPP, constant 2011 trillion $, and global share) – top 10 countries in 2015, 2020, and 2030
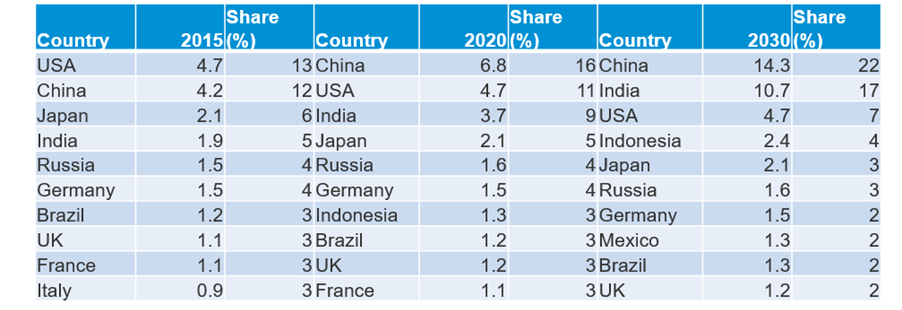
Source: Kharas 2017 – The unprecedented expansion of the global middle class
According to World Bank data, between 2012 and 2019, the global middle-income population increased from 5.4 billion to 5.8 billion. The pandemic is estimated to have erased a year of growth, leaving the global middle-class population unchanged from 2019 to 2020.
The effect of the COVID-19 economic downturn on the middle class and other income tiers shows distinct regional differences. South Asia has been the most affected, followed by East Asia and the Pacific. Meanwhile, in advanced economies, the middle class is estimated to increase as countries move from the high-income level to middle income.
Despite the many challenges, forecasts indicate that it will be this emerging middle class in East Asia and India that will show the biggest growth in demand for goods and services over the coming decades.
The economic overview of each of the six global regions is examined in more detail on their individual pages:
