
Search our website enhanced by Google.
Tuesday, 26 July 2022
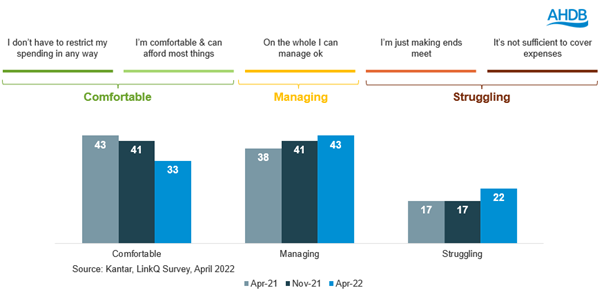
Research from Kantar suggests those who feel they are struggling financially jumped 5 percentage points in the last year to 22% of households.
To combat this increase in prices, buying less volume is currently the most effective coping strategy for shoppers according to Kantar (4 w/e 12 June 2022) contributing to a 5.3% fall in average price followed by shoppers choosing cheaper products (-4.9%). . Choosing products which are on promotion will save money compared to the previous price, but sometimes increases costs as shoppers may trade up into more expensive brands or products.
In the last 4 weeks we have seen an acceleration in the decline of branded products, losing £43m. While some shoppers have switched to value ranges, most of the brand losses have gone to standard own label products, benefitting these products by £27m (Kantar, 4 w/e 12 June 2022)
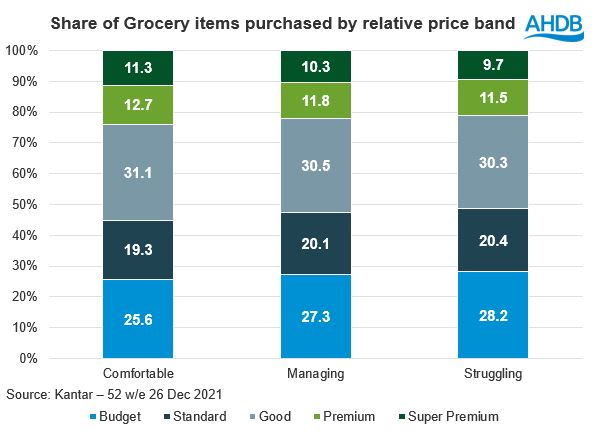
Only 2% of shoppers buy the majority of their groceries from value ranges, so even those who are struggling tend to buy a range of product tiers. However, those who are struggling are more likely to buy the cheaper ranges than someone who is better off.
Research from the ONS based on web-scraped supermarket data for 30 everyday grocery items, showed that the lowest-priced items have increased in cost in line with average food and non-alcoholic drinks prices (with both rising around 6% to 7% over the 12 months to April 2022). Although it did suggest there was a large variation between the top and bottom of the 30 items.
Beef mince was one of the products which saw the biggest increase while cheese saw a drop in price, according to the ONS. We have looked in more detail using our data sources to see how inflation is impacting other value cuts.
Price inflation is seen across the majority of dairy products and ranges from last year with few exceptions. The values for average price are based on actual price paid by shoppers, so can be impacted by product mix and promotions, and are not like for like product comparisons, but do provide some indication of relative price changes.
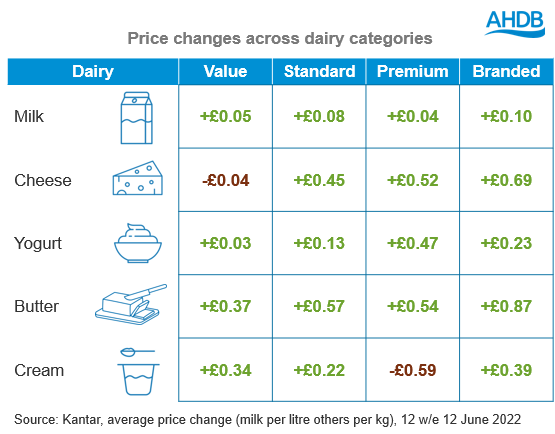
Standard milk, making up the vast majority of the market, has seen the highest price increase of 15.7%, with fairly high growth for the smaller branded sector of 11.6%.
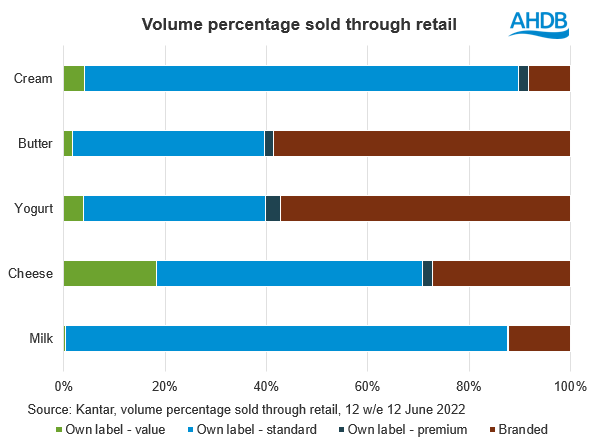
Very little value cheese is sold, and prices have remained low for that tier with higher price inflation across the other tiers, although notably less for premium at only 5%. Similarly, value yogurt ranges have experienced lower price inflation compared to both branded and standard tier. Again, for butter, the value ranges have experienced the least price inflation whilst premium and branded tiers have seen price increases. Famously for butter, premium brands have experienced high levels of price inflation at 14% year-on-year. Overall, cream has been the least impacted by rising prices, with an average price increase of 3.83% (Kantar, 12 w/e 12 June 2022).
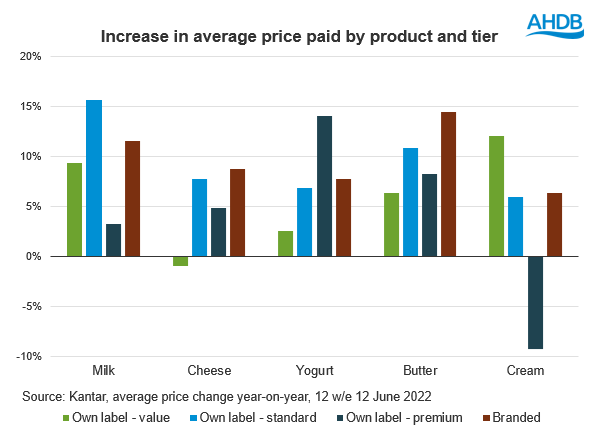
Value ranges for dairy are account for a tiny share and on average are not seeing prices rise faster than the market. However, standard ranges for many dairy products are seeing prices rise faster than premium tiers. For an everyday staple product like milk the price increase has had a more significant impact on consumers who on average have paid £1.30 more in the last 12 weeks on a smaller volume. Standard milk has seen the highest price increase of 15.7% but experienced the lowest reductions in volume sold for its category at 7.1% (Kantar, 12 w/e 12 June 2022).
It is difficult to attribute how much the drop in volumes is due to increased price, as we are comparing it to last year when Covid restrictions were in place and retail sales were higher as a result.
Retail volume levels have reduced across all categories apart from value range cheese and cream which have increased by 9.9% and 12.4% respectively. Premium butter has also seen higher volume sales through increased promotion. In general, premium and branded tiers have been declining faster than the average, which suggests shoppers may be switching down tiers in dairy to save money (Kantar, 12 w/e 12 June 2022). Frequency of purchase is also down as shoppers may be making products stretch for longer and reducing waste. Those thinking about cutting back on dairy products year-on-year has remained relatively consistent however this quarter we saw the highest proportion yet (14%) of consumers thinking about reducing their consumption of dairy because of the cost. However, this reason for cutting back does not surpass general concerns about health, welfare and the environmental. Overall consumption of dairy remains consistent.
As with meat, the least affluent shoppers have had to spend more on dairy while other social grades have been able to mitigate price rises through trading down or buying less. Those lower income households have spent £2.20 more over the last three months on milk for only 96% of the volume they bought last year.
There may be an opportunity in dairy for retailers to expand and increase the appeal of their value ranges in the short to medium term to support consumers in managing their basket spend.

While AHDB seeks to ensure that the information contained on this webpage is accurate at the time of publication, no warranty is given in respect of the information and data provided. You are responsible for how you use the information. To the maximum extent permitted by law, AHDB accepts no liability for loss, damage or injury howsoever caused or suffered (including that caused by negligence) directly or indirectly in relation to the information or data provided in this publication.
All intellectual property rights in the information and data on this webpage belong to or are licensed by AHDB. You are authorised to use such information for your internal business purposes only and you must not provide this information to any other third parties, including further publication of the information, or for commercial gain in any way whatsoever without the prior written permission of AHDB for each third party disclosure, publication or commercial arrangement. For more information, please see our Terms of Use and Privacy Notice or contact the Director of Corporate Affairs at info@ahdb.org.uk © Agriculture and Horticulture Development Board. All rights reserved.
