
Search our website enhanced by Google.
Thursday, 19 October 2023
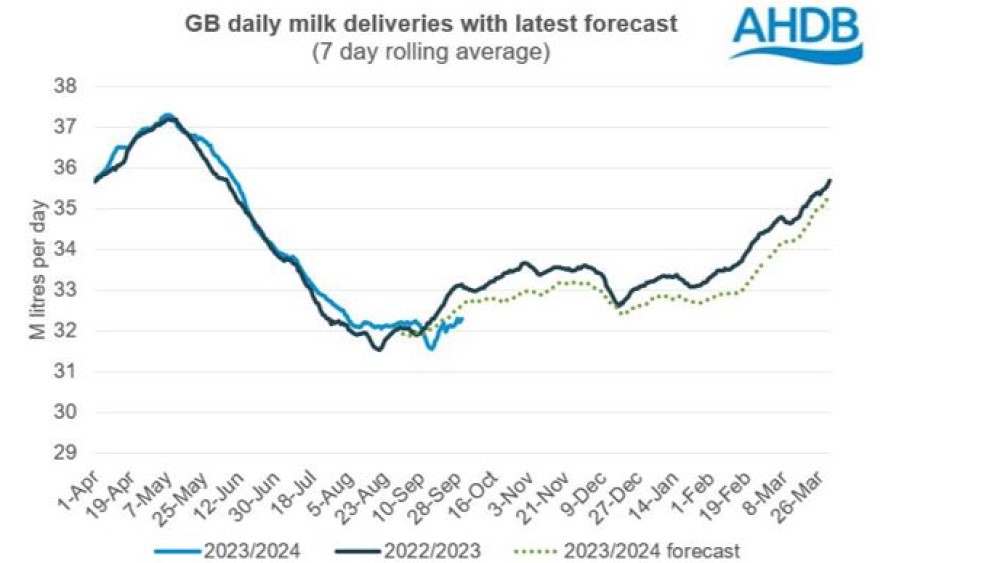
GB milk deliveries finally began to slow in September, after a strong summer of production, with estimated volumes for the month down by 1.1% year-on-year, or the equivalent of 13 million litres. This means that production is still ahead of 2022/23 in the year-to-date by 0.31%. Some of the drop off has been caused by disruption from milk haulier Lloyd Fraser going into administration mid-month. Anecdotal reports suggested that processors swiftly made other arrangements for collections and that a minimal amount was tipped. However, daily deliveries data indicate some disruption between 11 and 19 September.
Grass growth rates have remained exceptional since July due to a run of wet and mild weather, continuing in September. This will have boosted milk yields through the summer, although we are now beginning to see the impact of squeezed margins on feeding and retention rates.
The milking herd has continued it’s decline in numbers, by 0.6% this year dropping to 1.62 million head in July. There was also a decline in youngstock (under 2-year-old) populations as the increased youngstock numbers we saw in 2021 mature into the milking herd. To keep the herd size stable, we saw increased losses from the older groups with 6–8 year olds declining by -7.0% and 8 pluses declining by -4.5%.
Agricultural inflation levels have eased a lot since earlier in the year but many input costs remain at high levels and the continued declines in milk prices are impacting on farmers decision making with little appetite to push yields. Farmgate milk prices reported by Defra have stabilised for August, settling at 36.2ppl, a far cry from a year ago when prices were 23.9% higher.
Our latest forecast released in September predicted milk flows to slow down in the coming months with a conservative fall of at least 0.5% to be expected. There is scope for production to fall further if prices do not begin to recover this side of Christmas.
The latest outlook for EU production is for deliveries to increase 0.3% due to increased yields. They also expect growth in exports due to a competitive price point.
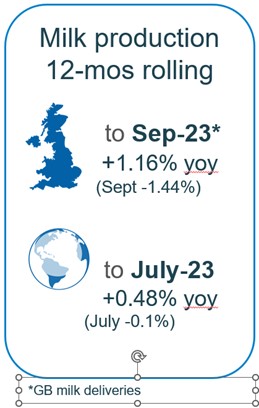
Global milk production in July fell into slight decline of -0.1% year on year. This still meant that the 12-month picture was up by 0.48% year-on-year but perhaps signs that as prices cool globally, the production tap is beginning to be turned down.
Overall price movements on UK wholesale markets were subdued through the bulk of Q3, but by the end of the quarter began to see some signs of some recovery. Generally, trade remained light as the market waited to see whether we had indeed reached the bottom of the curve. In September, cream prices improved by £25/t, SMP rose by £10/t, butter up by £30/t with mild cheddar declining by £70/t.
Positively, the last four GDT events saw increases in the Price Index, the latest increasing by 4.3% from the previous event to $3,202/t. This uplift was primarily driven by powders (SMP up by 4.3% and WMP up by 4.2%) but butter also increased by 2.9%. Cheddar was still struggling until the last auction, which will further add to the plight of cheese makers. However, even cheddar rose by 0.2% in the latest auction.
August saw prices soften on global dairy wholesale markets barring some gains in butter, WMP and cheese markets in US. Milk production remains seasonally low with demand continuing to be weak. Some revival of demand is hoped for after the summer holidays.
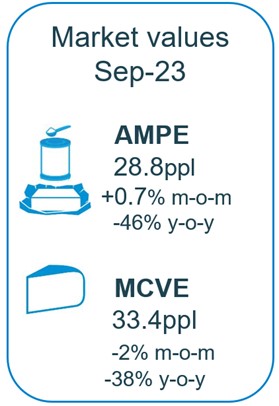
As of September, milk market values (which is a general estimate on market returns and the current market value of milk based on UK wholesale price movements) show some signs of stabilisation. AMPE rose by 0.7%, the first gain in months. MCVE still fell by a further 2% to 33.4ppl, however. Both indicators in the UK are now much lower than a year earlier, with AMPE and MCVE down by 46% and 38% respectively.
The latest published farmgate price was for August, with a UK average of 36.2ppl. Latest announced farmgate prices have been mixed in October with liquid milk contracts relatively steady but cheese contracts easing.
On retailer aligned contracts there was some minor positivity. Tesco and M&S held their prices for the month, while Sainsbury’s and Co-op announced increases of 0.34ppl and 0.12ppl respectively.
On non-aligned liquid contracts most announcements were for holds, with Crediton, Freshways, Grahams and Muller Direct making no change in October. However, Payne’s Dairies announced a price drop of 1.00ppl for the month.
Cheese contracts saw some negativity, likely because of challenging wholesale markets.
Global and domestic demand remain subdued. Latest Nielsen figures indicate volume falls in butter (-1.0%), cheese (-1.5%) and milk (-1.7%) although less steep than in previous months, whilst yogurt and cream have returned to modest growth (=0.1% and +0.7% respectively (source: Nielsen Homescan, 12 we 9 Sep 23).
Chinese demand has remained disappointing thus far due to increased Chinese domestic dairy production and economic challenges.
The latest trade figures were generally positive for Q2. Export volumes of dairy products from the UK have increased in the second quarter of 2023 year-on-year. Total export volume for Q2 2023 was 336,000 t, an increase of 22,300 t from Q2 2022. The level of EU exports increased by 10,900 t while that to non-EU destinations increased by 11,400 t. Total import volumes are down over 48,700 t (-14%) at 293,900 t in Q2 2023. Imports from EU nations declined by 47,100 t (-14%) on Q2 2022. Imports from non-EU nations declined by a meagre 1,600 t.

Sign up to receive the latest information from AHDB.
While AHDB seeks to ensure that the information contained on this webpage is accurate at the time of publication, no warranty is given in respect of the information and data provided. You are responsible for how you use the information. To the maximum extent permitted by law, AHDB accepts no liability for loss, damage or injury howsoever caused or suffered (including that caused by negligence) directly or indirectly in relation to the information or data provided in this publication.
All intellectual property rights in the information and data on this webpage belong to or are licensed by AHDB. You are authorised to use such information for your internal business purposes only and you must not provide this information to any other third parties, including further publication of the information, or for commercial gain in any way whatsoever without the prior written permission of AHDB for each third party disclosure, publication or commercial arrangement. For more information, please see our Terms of Use and Privacy Notice or contact the Director of Corporate Affairs at info@ahdb.org.uk © Agriculture and Horticulture Development Board. All rights reserved.
