
Search our website enhanced by Google.
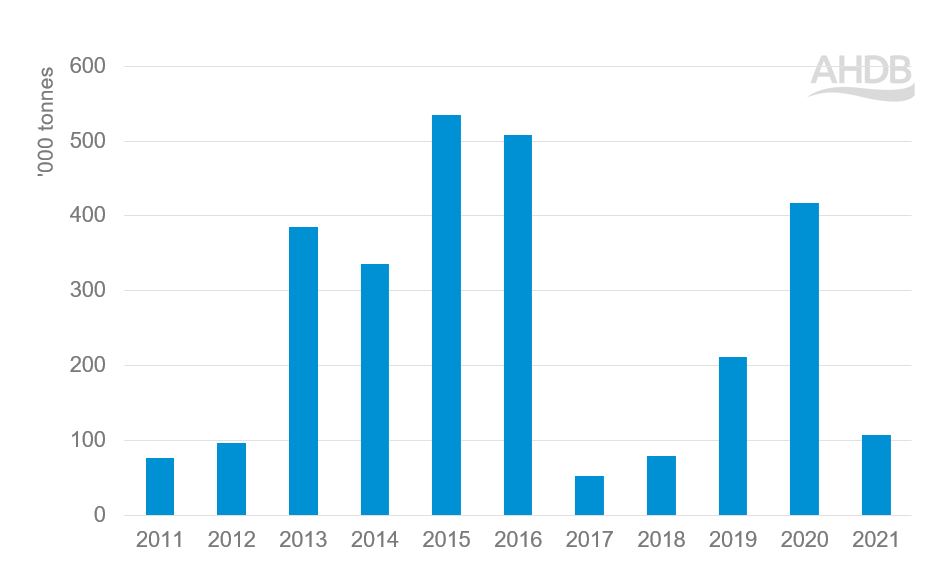
Figure 1. UK beef and bovine offal exports to non-EU countries, 2011–2021
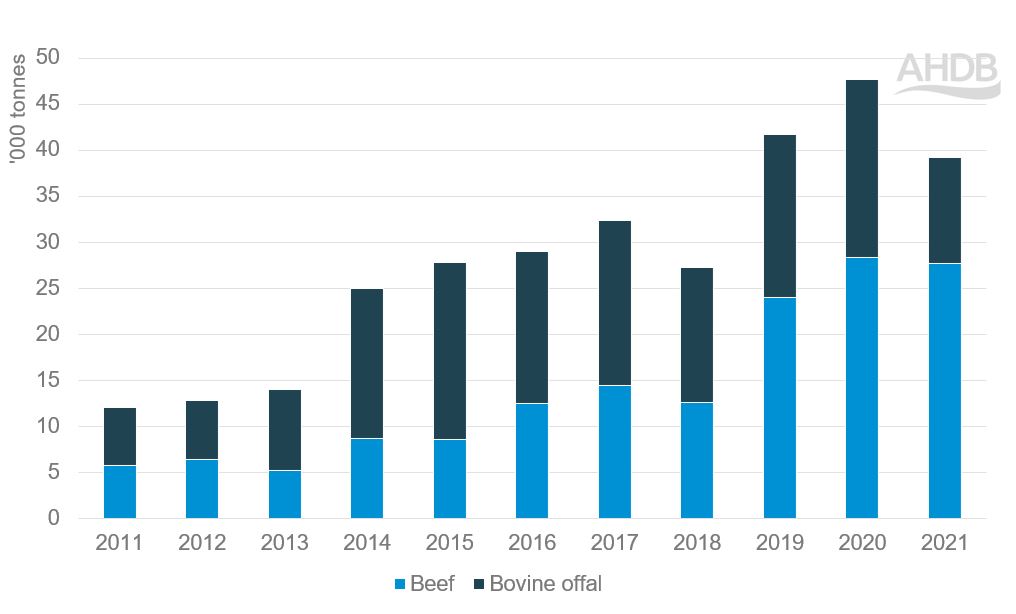
Source: UK HMRC complied by Trade Data Monitor LLC
Figure 2. UK beef exports to non-EU countries, 2019–2021 average
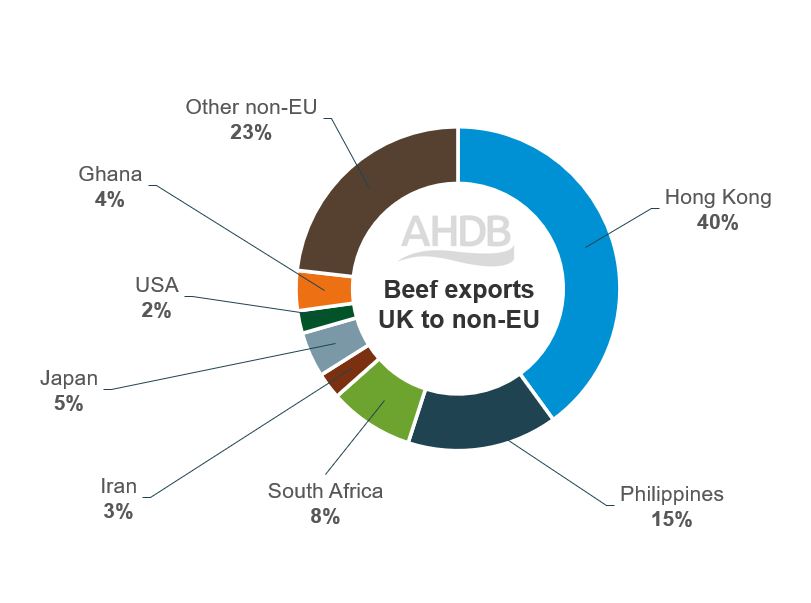
Source: UK HMRC compiled by Trade Data Monitor LLC
Figure 3. UK beef offal exports to non-EU countries, 2019–2021 average
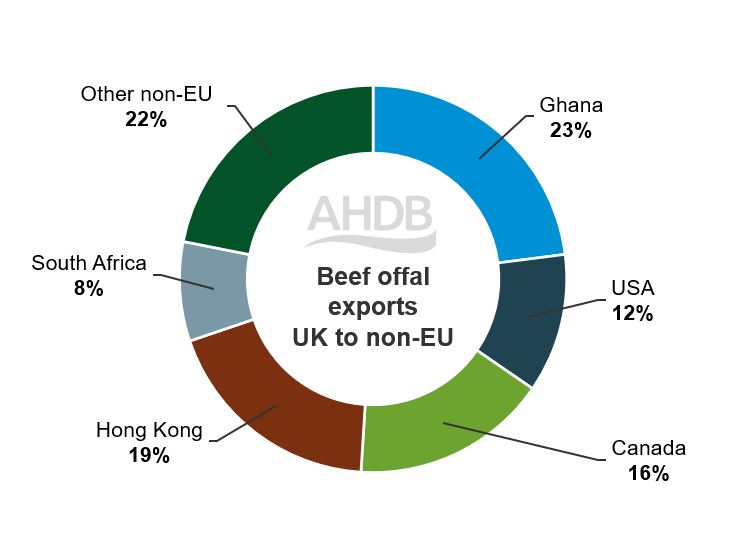
Source: UK HMRC compiled by Trade Data Monitor LLC
Figure 4. UK sheep and sheep offal exports to non-EU countries, 2011–2021
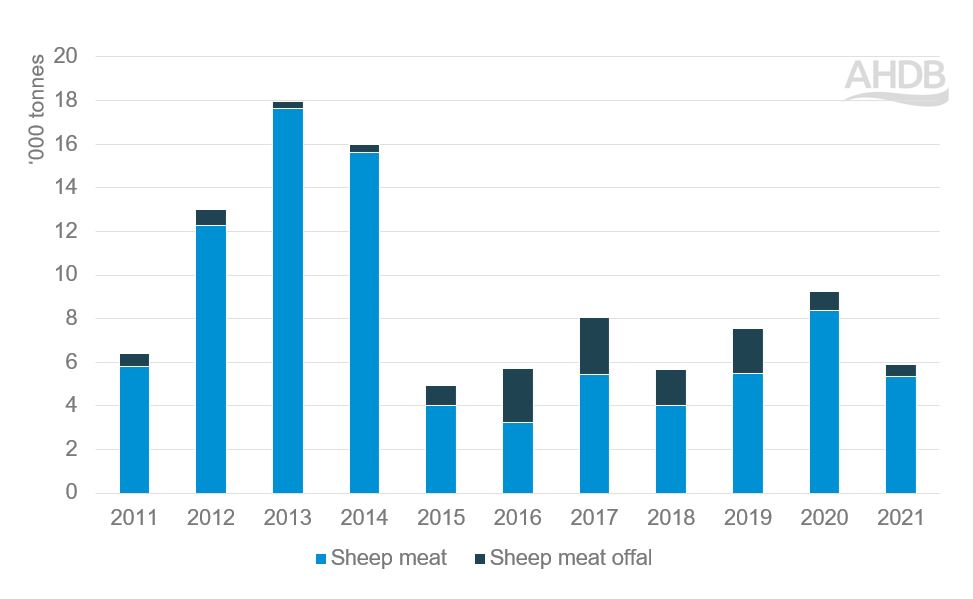
Source: UK HMRC compiled by Trade Data Monitor LLC
Figure 5. UK sheep meat exports to non-EU destinations, 2019–2021 average
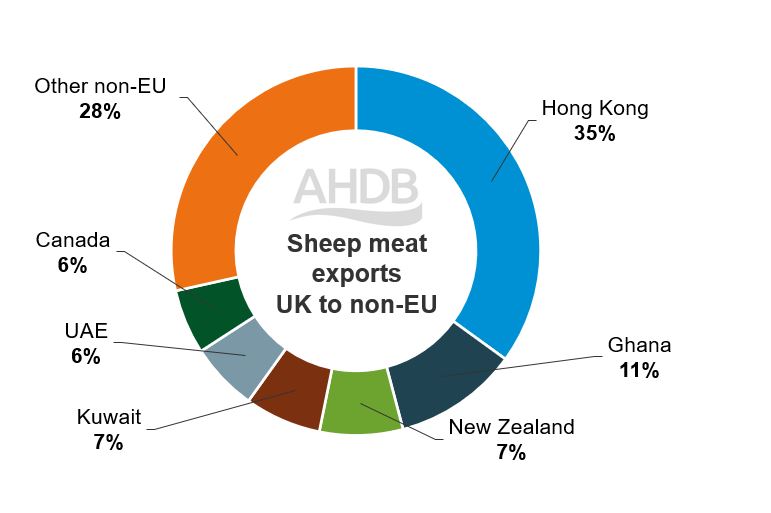
Source: UK HMRC compiled by Trade Data Monitor LLC
Figure 6. UK sheep offal exports to non-EU destinations, 2019–2021 average
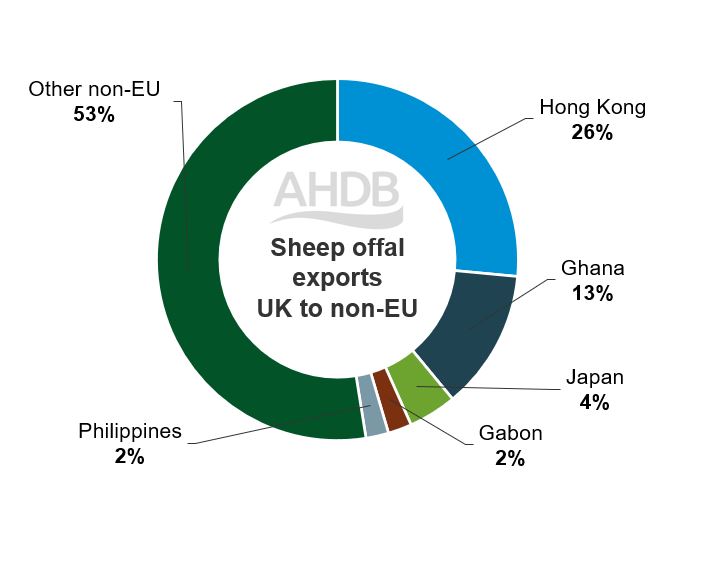
Source: UK HMRC compiled by Trade Data Monitor LLC
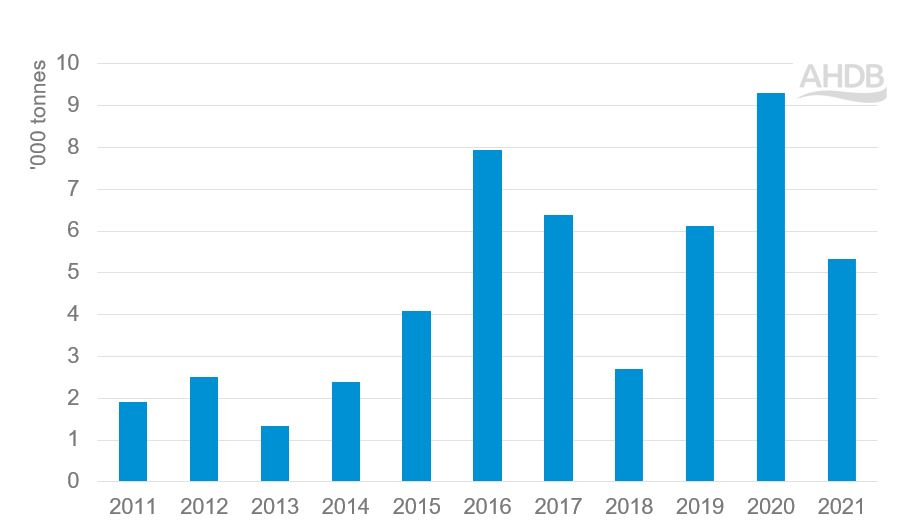
Figure 7. UK pig meat exports to non-EU destinations, 2011–21
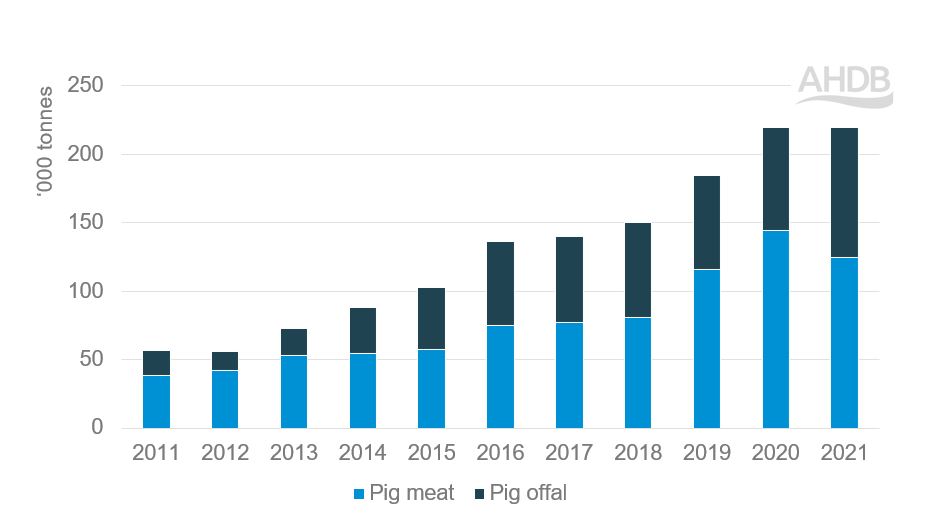
Source: UK HMRC compiled by Trade Data Monitor LLC
Figure 8. UK pig meat exports to non-EU destinations, 2019–2021 average
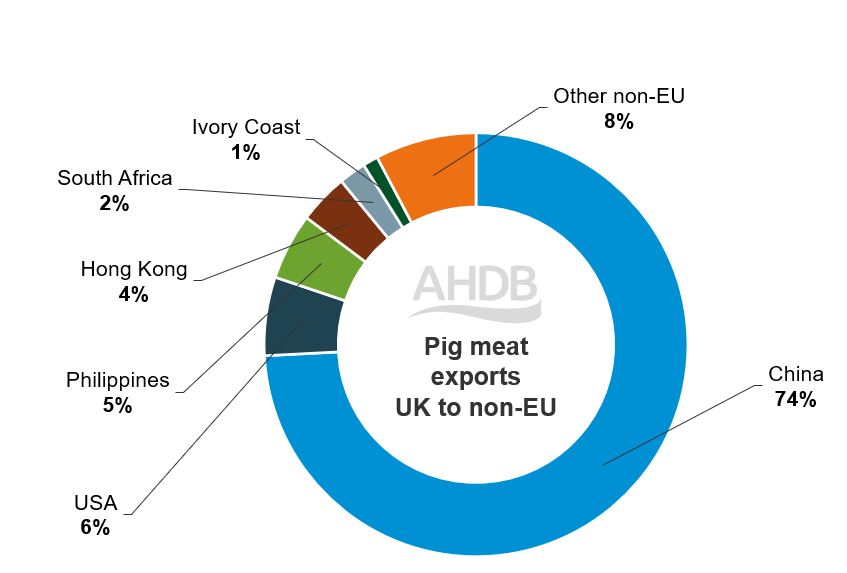
Source: UK HMRC compiled by Trade Data Monitor LLC
Figure 9. UK pig offal exports to non-EU destinations, 2019–2021 average
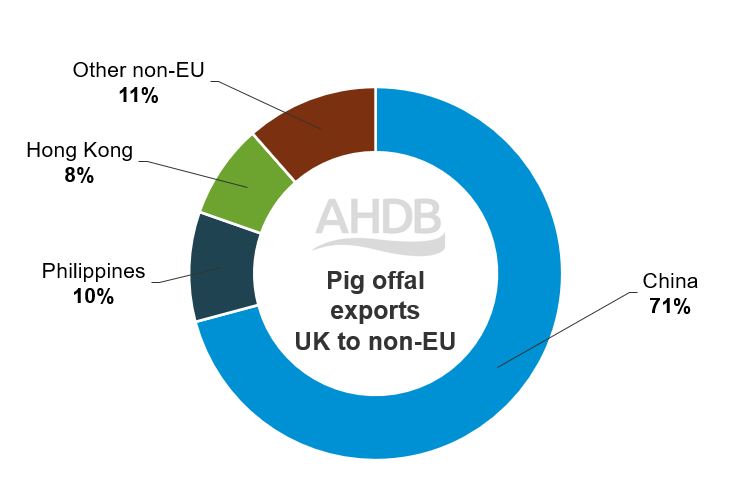
Source: UK HMRC compiled by Trade Data Monitor LLC
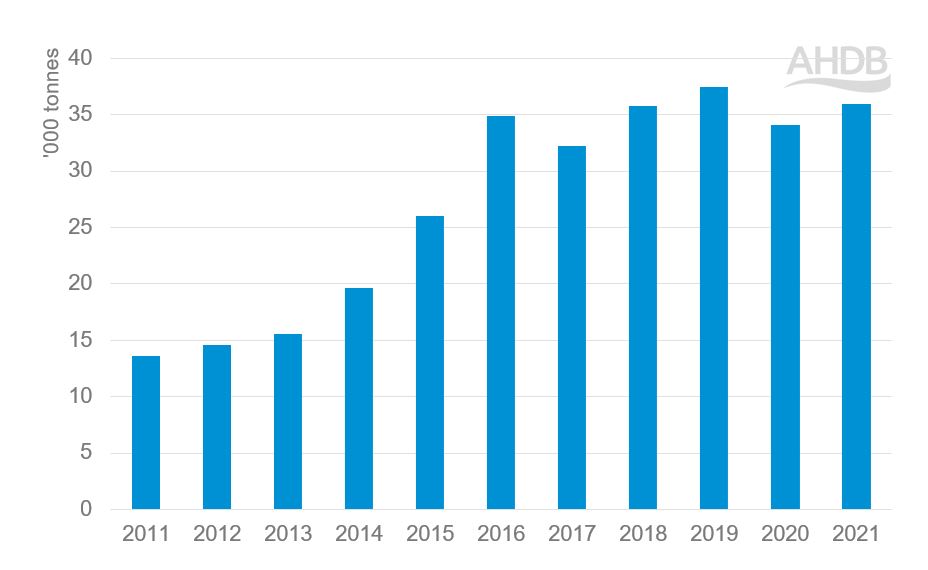
Figure 10. UK butter exports to non-EU destinations, 2011–21
Source: UK HMRC compiled by Trade Data Monitor LLC
Figure 11. UK butter exports to non-EU destinations, 2019–2021 average
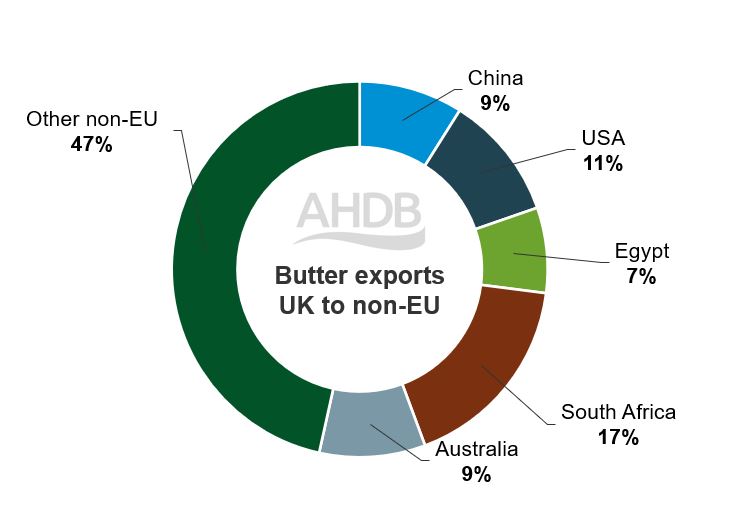
Source: UK HMRC compiled by Trade Data Monitor LLC
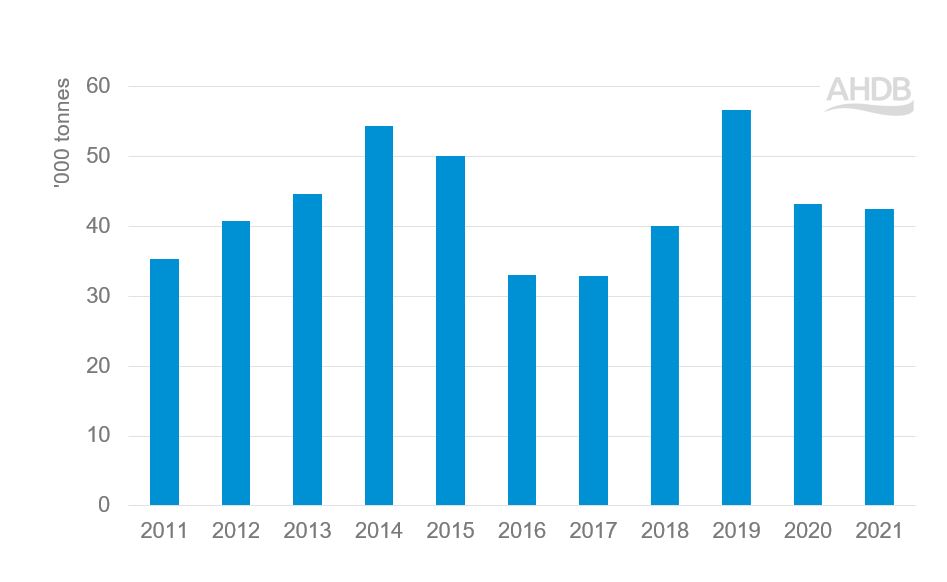
Figure 12. UK cheese exports to non-EU destinations, 2011–2021
Source: UK HMRC compiled by Trade Data Monitor LLC
Figure 13. UK cheese exports to non-EU destinations by country, 2019–2021 average
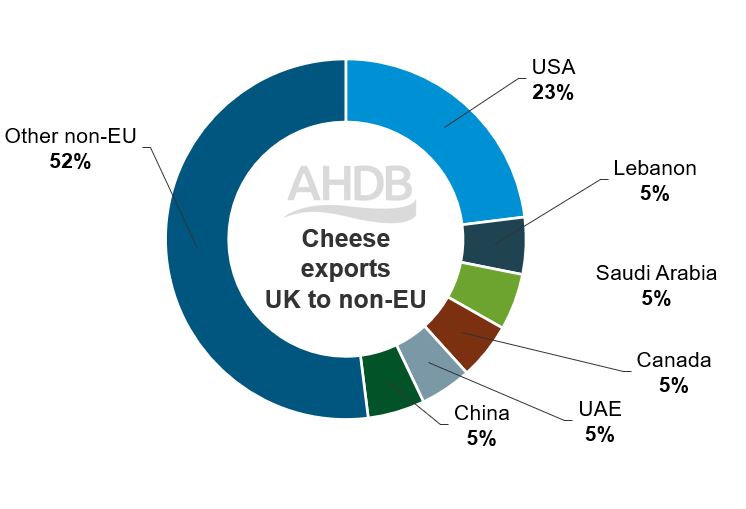
Source: UK HMRC compiled by Trade Data Monitor LLC
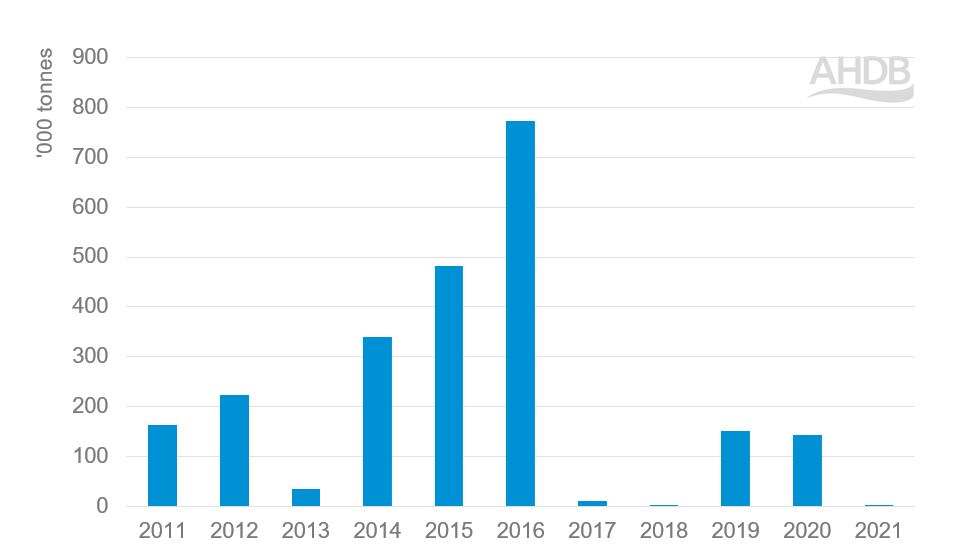
Figure 14. UK milk powder exports to non-EU destinations, 2011–2021
Source: UK HMRC compiled by Trade Data Monitor LLC
Figure 15. UK milk powder exports to non-EU destinations by country, 2019–2021 average
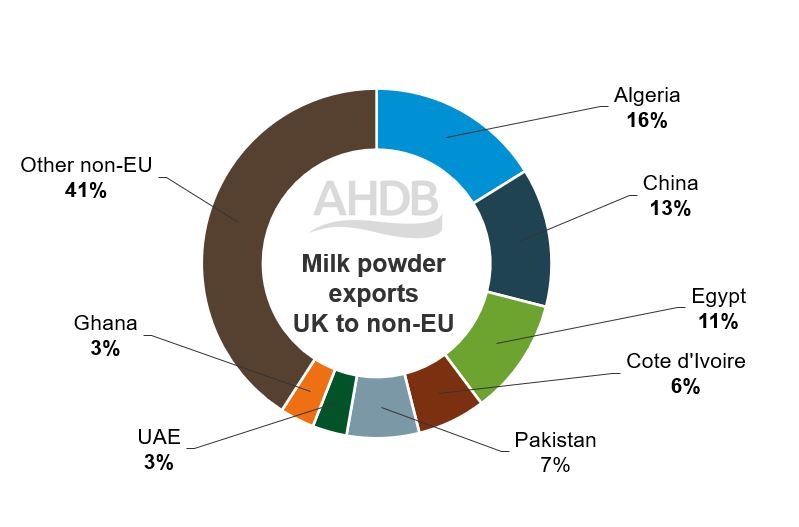
Source: UK HMRC compiled by Trade Data Monitor LLC
Figure 16. UK wheat exports to non-EU destinations, 2011–2021
Source: UK HMRC compiled by Trade Data Monitor LLC
Figure 17. UK barley exports to non-EU destinations, 2011–2021
Source: UK HMRC compiled by Trade Data Monitor LLC
